PART-5
This is the last part of Google Analytics in which you will get all your answers. The last term we’re going to discuss today is Cohort Analysis in Google Analytics.
First of all, let’s get to know what does Cohort Analysis mean in Google Analytics.
Cohort Analysis is a subset of behavioral analytics which actually picks up the data from a given dataset (e.g. an ecommerce platform) and even it doesn’t look at all users as one unit, it breaks them into related groups for analysis purpose. Below is the Google Analytics Cohort Report.
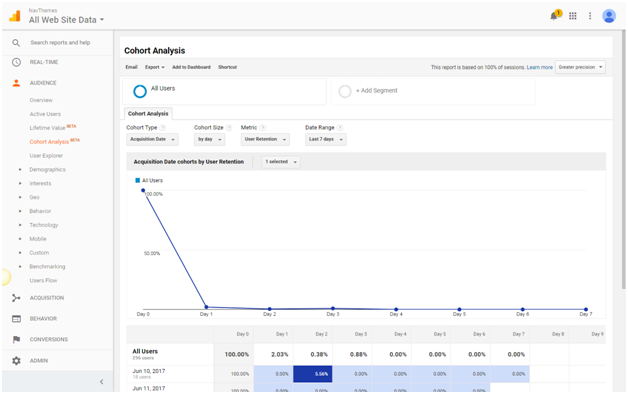
The set up is at the top of the report where you see acquisition type, cohort size, metric and date range.
First, Cohort Type is the acquisition date which is the only one option right there. Basically, it is the date of the first session.
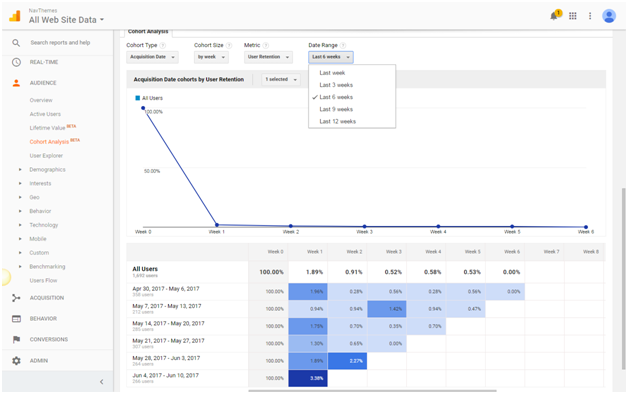
Cohort Size is the time window that you want to use when you’re looking at the cohort type. You can view it as by:
- Day
- Week
- Month
If we talk about Date Range, you can set it accordingly as shown in the below screen shot:
Let’s talk about Cohort Metric. It is simply the data that you will see down in the report. It consists of the dropdown of metric.
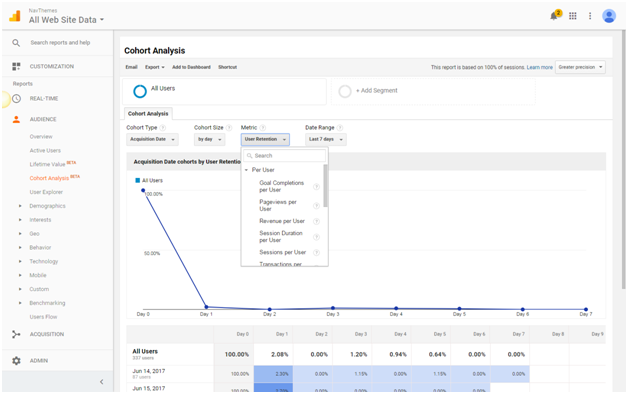
It will show some reports graphically as:
- Goal Completions per user
- Page Views per user
- Revenue per user
- Session Duration per user
- Sessions per user
- Transactions per user where are
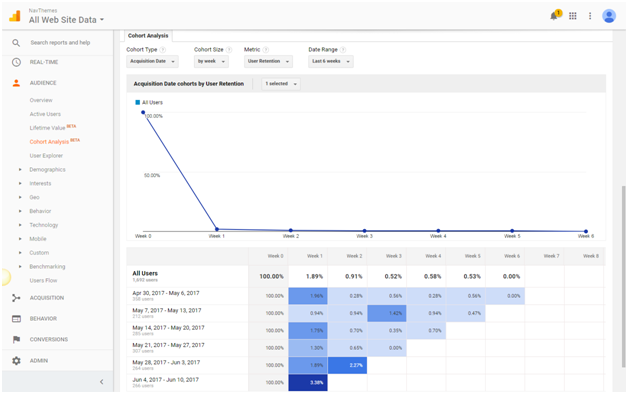
There will only be single user retention which is graphically shown as:
Let’s dive in a little bit more than metrics.
So, you can set this report with all sessions and users who’d completed transaction. Don’t lost!! When you will do it practically with your own website then you will come to know how interesting it is! Although, this is just a trend in data that how we are going to analyze this.
So, we were talking about User Retention in Google Analytics
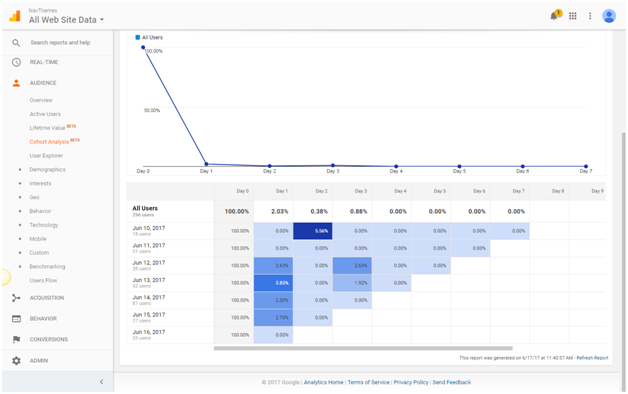
Now, you can see the data from the Day 0 is the visit of the user from the very first day. The column is showing below the Day 0 is the percentage of users that returned to the site so they were retained within the site on day 1 day 2 and so on.
Now, looking at that part where the percentages are higher, and users came back. So, you really want to overlay this information with the context of your marketing initiatives. We can change it with the date range by daily, weekly or monthly.
This is how we can select various metrics in Google Analytics and can have the information about relevant data.
So, finally we are done with Cohort Analysis in Google Analytics.
Now, you don’t need anyone to guide you about Google Analytics, you can apply it by yourself. It is not a big task. Believe and do it. This will make your business grow as you will have the ability to analyze single bits of data.