PART 2
In my previous article I have described step by step method to setup Google Analytics in your website. So, you have signed up. You might have tried out switching accounts and set up properly.
Coming on to one step ahead of login part, when you logged in, there will be a graph which shows the number of visits per day and on the top right hand corner, you can change the date and range. It will show the statistics accordingly. You can also change it as hourly, weekly and monthly.
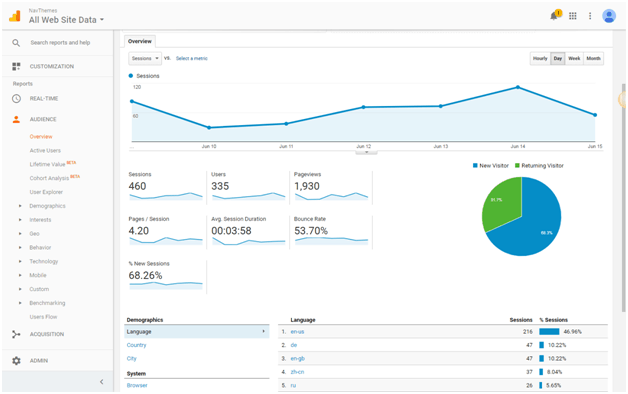
So, below the graph shown above, there are some terms which might sound confusing for you. Let’s differentiate and start with the first term Sessions
- Session in Google Analytics
Session in Google Analytics represents the number of individual sessions initiated by all the visitors on your website. If a user is inactive on your site for 30 minutes or more, then future activity is counted as a new session. There are basically two methods by which a visit ends. One is after every 30 minutes of inactivity by the user and another one is at the end of the day at midnight.
- Users in Google Analytics
Users in Google Analytics are simply the total number of people who visited your blog/website for a specific time period and this has nothing to do with the number of pages they visited or how long they stayed on the page. It is just the total number of people who opened your website.
- Pageviews in Google Analytics
Page Views are the total number of pages loaded on the website for a specific time period. So, each time a page is opened on the browser a page view is recorded.
- Page/Session in Google Analytics
Pages per session are the calculation of average number of pages viewed in per session.
- Average Session Duration in Google Analytics
It is the average time spent on the blog by each visitor in a session.
- Bounce Rate
It represents the number of people who visited the site and left it without performing any event.
- Percentage of New Sessions
It represents the percentage of session of a new visitor.
And, if you look right at the page below the terms, you’ve a pie chart which represents new and returning visitors. It is always good to get new visitors but you have to put an effort to have the old visitors coming back to the site again and again.
As you can see, Google Analytics is very detailed.
- Customization
On the side bar, if we click on customization, it allows us to create custom reports.
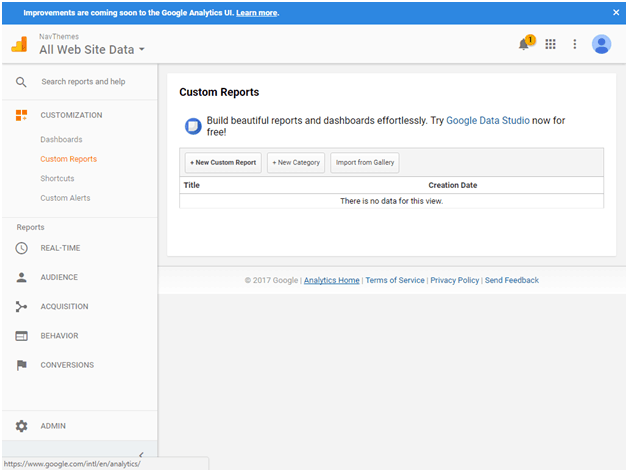
Custom Reports are basically summaries of all the analytics data and you choose which data you want to add in your report. These reports can be incredible time savers.
- How to Create Custom Report in Google Analytics
- Give your report a name
- Choose report type from three options explorer, flat table and map overlay.
- You need to choose dimensions and metrics. (Dimension is like descriptive characteristic and metric is like an individual element. Metrics are individual elements of dimensions. So, dimensions are associated with one or more metric. These are going to be the part of table. )
- Click on save and a report will be generated.
Let us move on to the admin tab.
- Admin Tab
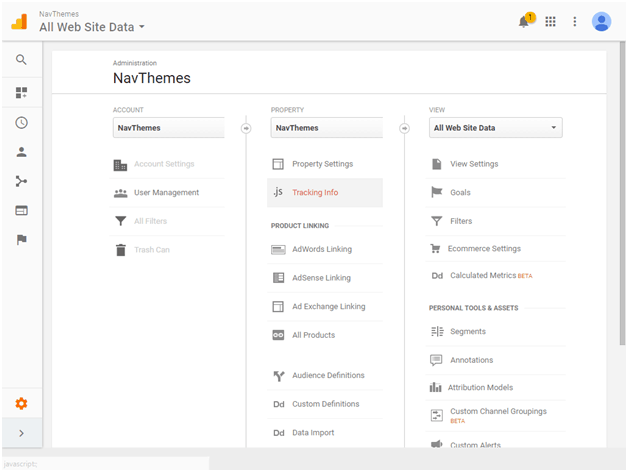
Accessing the account and property information are important to the actual owner of the website.
The main point is the information that we are getting from the Analytics.
- Clicking on view settings, we can have access to the information like time zone of the blog, e-commerce settings and site search tracking etc. It also include some security based information like View ID.
- We can check out the goals as well if they are set. It is a good way to check that whether your goal has been completed on time or not.
- Next point is filters, filters allow you to limit specific data that you don’t want to be the part of the report.
- Personal Tools and Assets
- SEGEMENTS: It allows to isolate specific type of traffic within Google Analytics Reporting.
- ANNOTATIONS: They are mainly for letting users leave notes on the graphs so you can mark important happenings according to the date.
- ATTRIBUTION MODELS: It is basically concerned with determining the value of each customer which is helpful in understanding the customer’s perspective.
- CUSTOM CHANNEL GROUPING: It is a set of labels where each label is applied to a channel or a group of channels that you would like to see in your reports. So, when you define channel grouping you specify which channel belongs to which label.
- CUSTOM ALERTS: Google Analytics has an engine that monitors your traffic, posts and alerts if it sees something unusual. So, if your traffic drastically drops, it will definitely alert you.
- SCHEDULED EMAILS: So, with scheduled emails Google lets you export any of the reports and you can scheduled it to be emailed daily, weekly, monthly and even quarterly.
Coming back to the admin
Shortcuts are actually really cool. They remember your settings so you don’t need to reconfigure a report each time when you open it.
We are left with Share Assets.
They mainly allow you to share custom reports and add dashboards.
The Google Analytics dashboard system is great because it’s like a little summary. So, if you are ever short on time, but you still want to see your performance, you just login quickly, have a look at your customized dashboard in Google Analytics, and sink in the information and quickly logout.
Hope you like the information and stop thinking. Just start analyzing these points in your real time project and comment if you have any query.